


On the 4H (BTC) Bitcoin analysis chart, we can see that the cryptocurrency dominance has been rising for the last days. We can also see the so-called rising wedge. In terms of technical analysis, it is a turnover formation. Usually, this formation ends with breaking down the bottom trend and continuing downwards.
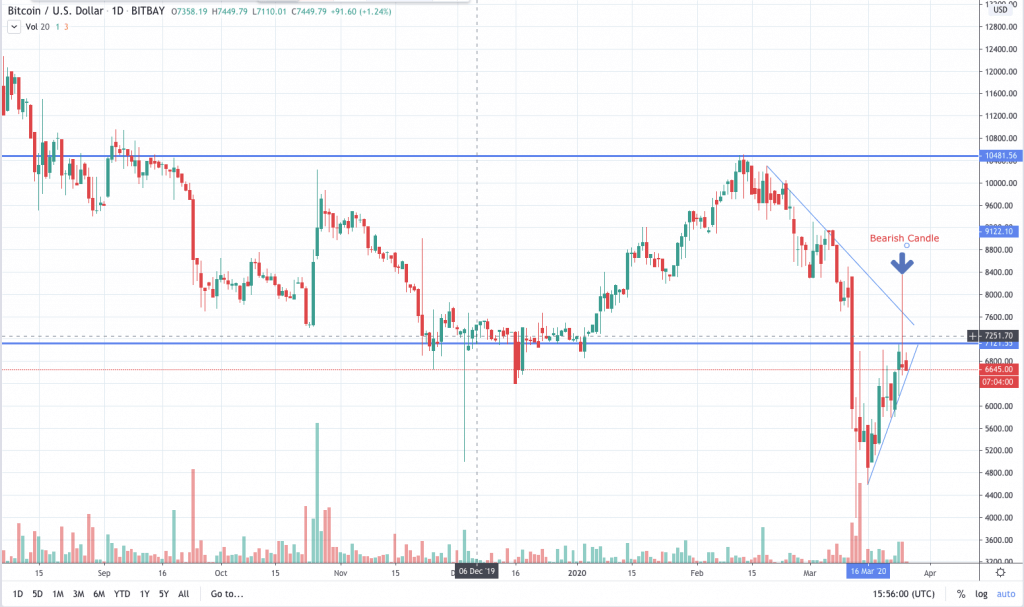
We can see prices rising, but at the same time, the volumes in this rise are directly pitiful. It does not indicate anything useful. These volumes are increasingly bearish signals than that we should go somehow significantly up. Although it may seem like that, there is no bullish signal yet. On the chart, tested price of nearly $7,000 is marked twice. In both cases, we see a rejection. There are two possible options.
Bitcoin Analysis
The first (less likely) option is to break through the rising trend board rising trend and also levels around $7000. Subsequently, the continuation of prices towards UP and test the blue pattern, which nicely seen on the 1D chart. If we are below this trend, we are still bearish. Here, it can come brief fake break rising wedge up and then down. If we breakthrough, we need to see mainly large volumes. Without that, we should not consider such a break as necessary (rather than an evil whales joke).
The second option is breaking down the wedge with the first flag on the surface of about $5700. It is not possible to know what intensity will move down after breaking the bottom trend wedge. It could go calmly lower. This option seems to be the most likely.
According to our bitcoin analysis, lets not forget that, as is customary in the crypto world, the above mentioned fake break may come. Therefore, do not get caught and rather wait. Maybe it would be worth the risk to open shortly, but it is up to each of you.
Domination
The analysis for Bitcoin shows that the dominance of this particular cryptocurrency is inevitable. As for Bitcoin, nothing has fundamentally changed since last week. In the 4H time zone, we see movement in the channel. As I mentioned earlier, concerning what is currently happening in the world regarding coronavirus, we can expect any reversal at any time. So we have to wait for a clear break and especially confirmation of this break, whether the upper or lower trend line. Based on this, we can further assume the following movement.
We are currently seeing a slight hint of rejection from the top trend line, but so far, it is too weak. If we broke the blue trend, the cryptocurrency dominance could start to fall again, and therefore the capital should leave the BTC. If that is the case, then we have to wait. And where will the capital move?
Will it be fiat or alts? That is a question for a million today.
Altcoin market cap
When we look at the 4H graph, we see an almost identical case to the BTC graph. The BTC and TOTAL2 (altcoin market cap) charts are currently very similar. We expect the same scenario here and, therefore, move down.
The structure of this chart even seems like if you were standing over the abyss and trying to balance the last forces as much as you can. As soon as we break the bottom trendline that we are currently moving on, we should continue at least to the previous low. We expect a fall here. Therefore, you should be cautious at altcoins right now.
Check out our Facebook page for article updates: https://www.facebook.com/everydaycryptonews/
